django-statsd
A while ago Jeff Balogh and James Socol got statsd and graphite running for web development projects at Mozilla. They wrote some great code including pystatsd and commonware. This allows us at a glance to see what's going on in AMO and SUMO and whole host of other projects.
Since then graphite has become a key part of our process. I can't imagine running a large site without it. I started playing around with some tighter integration between Django and pystatsd a while back. That resulted in a pull request to pystatsd which James didn't want, he wanted to keep pystatsd Python only. Made sense, so then I wrote django-statsd which provides some optional deeper integration between Django and statsd.
To install add in INSTALLED_APPS:
django_statsd
You can now choose your client by configuring settings.py. By default statsd will send UDP packets on your development box. To turn that off use a null client, for example:
STATSD_CLIENT = 'django_statsd.clients.null'
You'd use django_statsd.clients.normal on your production boxes, or anything you want to measure.
This library includes a few useful ways of sending timings. I pulled the middleware out of the afore mentioned commonware (credit to James and Jeff for that) so that you can time every request in Django. That's as simple as:
        MIDDLEWARE_CLASSES = (
                'django_statsd.middleware.GraphiteRequestTimingMiddleware',
                'django_statsd.middleware.GraphiteMiddleware',
                ) + MIDDLEWARE_CLASSES
I included a couple of hairy monkey patches that allow you to time all db and cache calls. You can turn that on by doing the following:
        STATSD_PATCHES = [
                'django_statsd.patches.db',
                'django_statsd.patches.cache',
        ]
That would be nice to run on a dev or stage site where you can test performance metrics. You can of course send stats the boring old way:
        from django_statsd.clients import statsd
        statsd.incr('response.200')
And that's about it for sending data. If you have all the remaining pieces in place (namely pystatsd installed and configured and pointing to statsd and graphite) you should now have data coming in.
For development, there's some data that's going astray, namely these UDP packets. It would be nice to display that information. For that I integrated with django debug toolbar so that you can view the statsd data that would have been sent on that request.
This configuration is a bit tricky but you'll need to change the following:
        MIDDLEWARE_CLASSES = (
             'debug_toolbar.middleware.DebugToolbarMiddleware',
             ...
        ) + MIDDLEWARE_CLASSES
Note: this must go before the GraphiteMiddleware so that we've got the timing data in before we show the toolbar panel.
Add in the panel:
        DEBUG_TOOLBAR_PANELS = (
             ...
             'django_statsd.panel.StatsdPanel',
        )
Set the client:
STATSD_CLIENT = 'django_statsd.clients.toolbar'
Now you can see your statsd timings in the toolbar. Here's an example with all the patches and middleware enabled
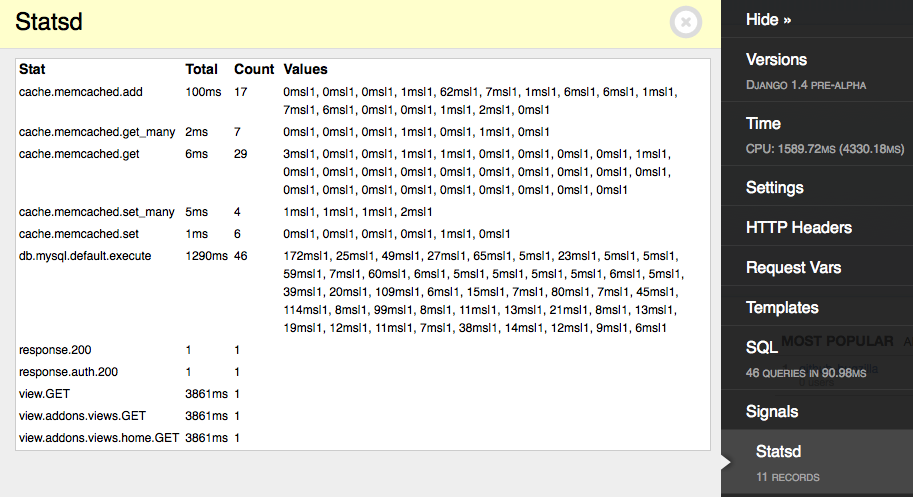
This shows you data locally which is useful, but does not aggregate it. That's not too useful for development boxes. The debug toolbar already shows you this information, what we want is the graphite aggregated on the server.
To link up to the data in graphite you can add some more configuration. The following is the internal mozilla configuration for addons.mozilla.org (this will not work for you).
        TOOLBAR_STATSD = {
                'graphite': 'https://graphite-phx.mozilla.org/render/',
                'roots': {
                        'timers': ['stats.timers.addons-dev', 'stats.timers.addons'],
                        'counts': ['stats.addons-dev', 'stats.addons']
                }
        }
And clicking on a key you'll get the data of that key on your live servers for example:
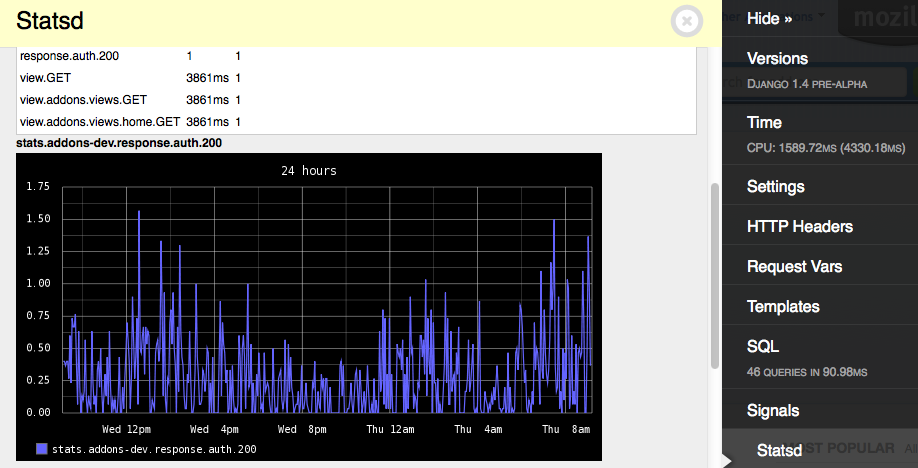
Plus this also saves you having to use the Graphite web api to find a graph and so on. When you are developing a page you can see how often that page is hit, how fast it is and so on, right from the toolbar.
That's it for now, but I hope to add some more tests and add timings for more things, including redis and urlconf.
Note: because django-statsd already existed on pypi, it's on pypi as django-statsd-mozilla so to install use: pip install django-statsd-mozilla.
Update: Sidnei da Silva has an awesome twisted client for statsd. He gave some pointers to speed up statsd. Connecting with old friends working on the same things again years later is pretty awesome.